Eye-tracking visualizer
Project attribution: Project done in a SCRUM team along with Mino Keuren, Teun Kortekaas, Valentijn van den Berg, Rick van der Heijden and Kelvin Toonen.
Source: The project’s source code is unavailable.
Short description: Website that provides 4 visualizations for eye-tracking data.
Technologies: Python, Django, Bokeh.
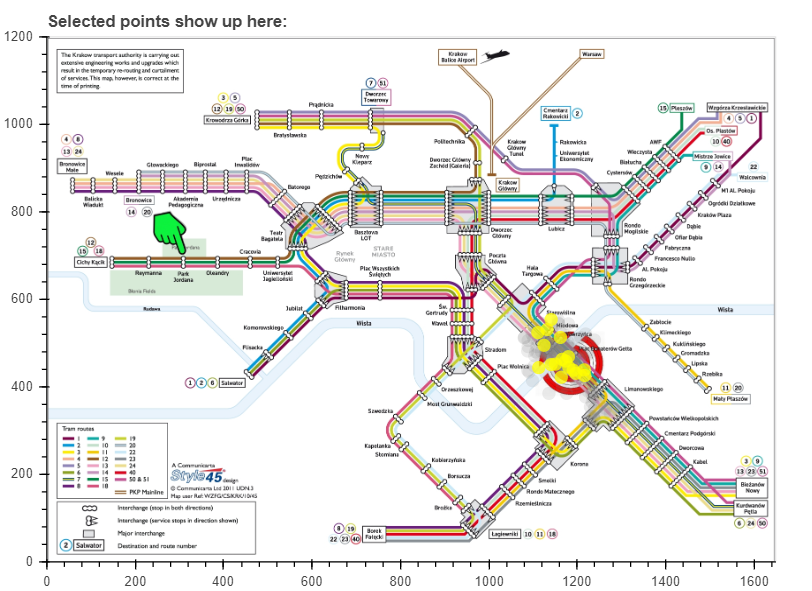
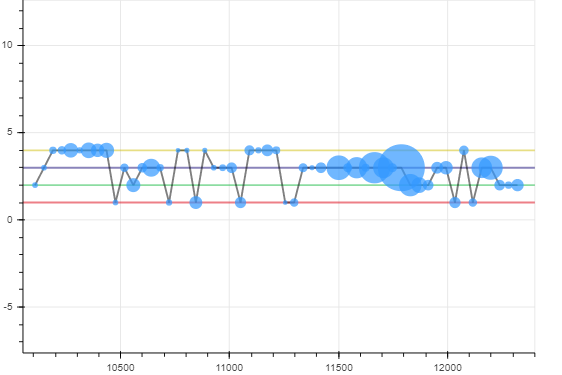
What I did: I contributed to the heat map and I implemented the time plot, and integrated it in the Django infrastructure.
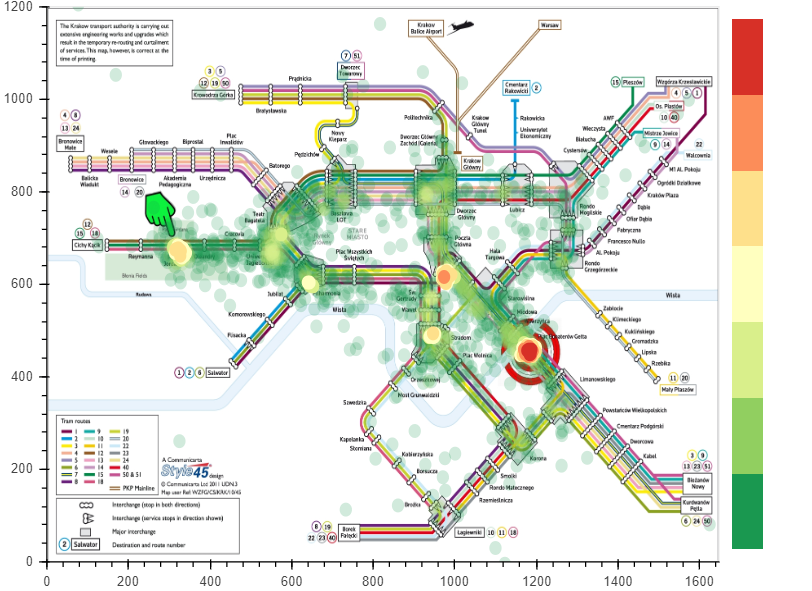
The website was written in Python with the Django library and it that provides visualizations for eye-tracking data. The visualizations were made with the Bokeh library. The used dataset was of metro maps, however the website can display any eye-tracking data for any other use case.
The website provides the following visualizations:
- Heat map
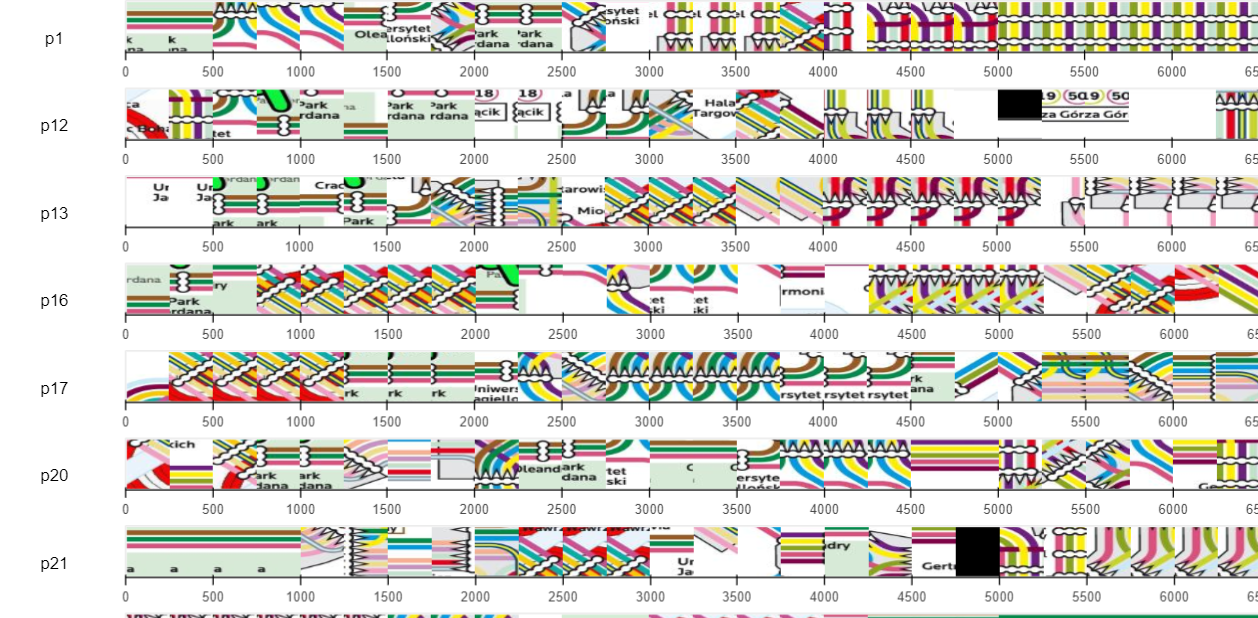
- Gaze stripes
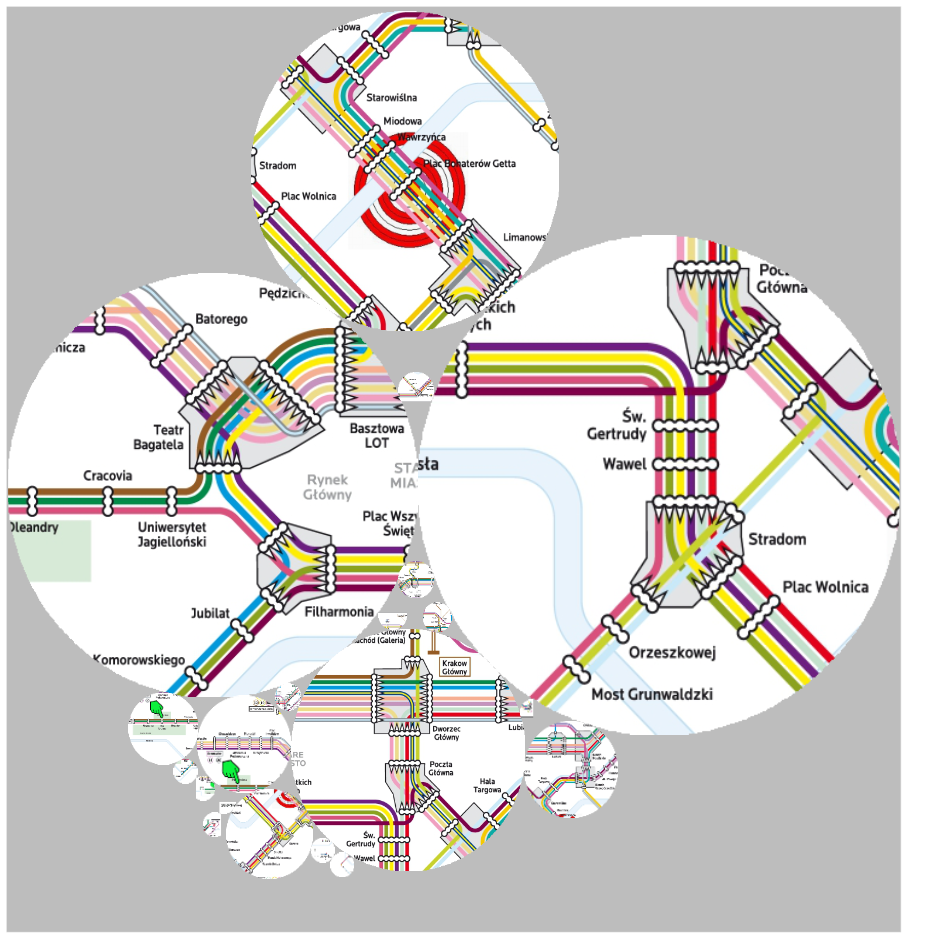
- Eye cloud
- Time plot

